Features.
Everything you need to understand your venue.
Sales & Events Chart
This chart compares your venue’s sales and event activity against competitors, showing both past performance and future business on the books.
With filters for date range, event type, revenue category, and delegation size, you can refine the data to uncover deeper insights.
It also reveals forward pace, showing what the future looks like and helps you make proactive decisions to optimise yield, adjust pricing strategies, and drive sales.

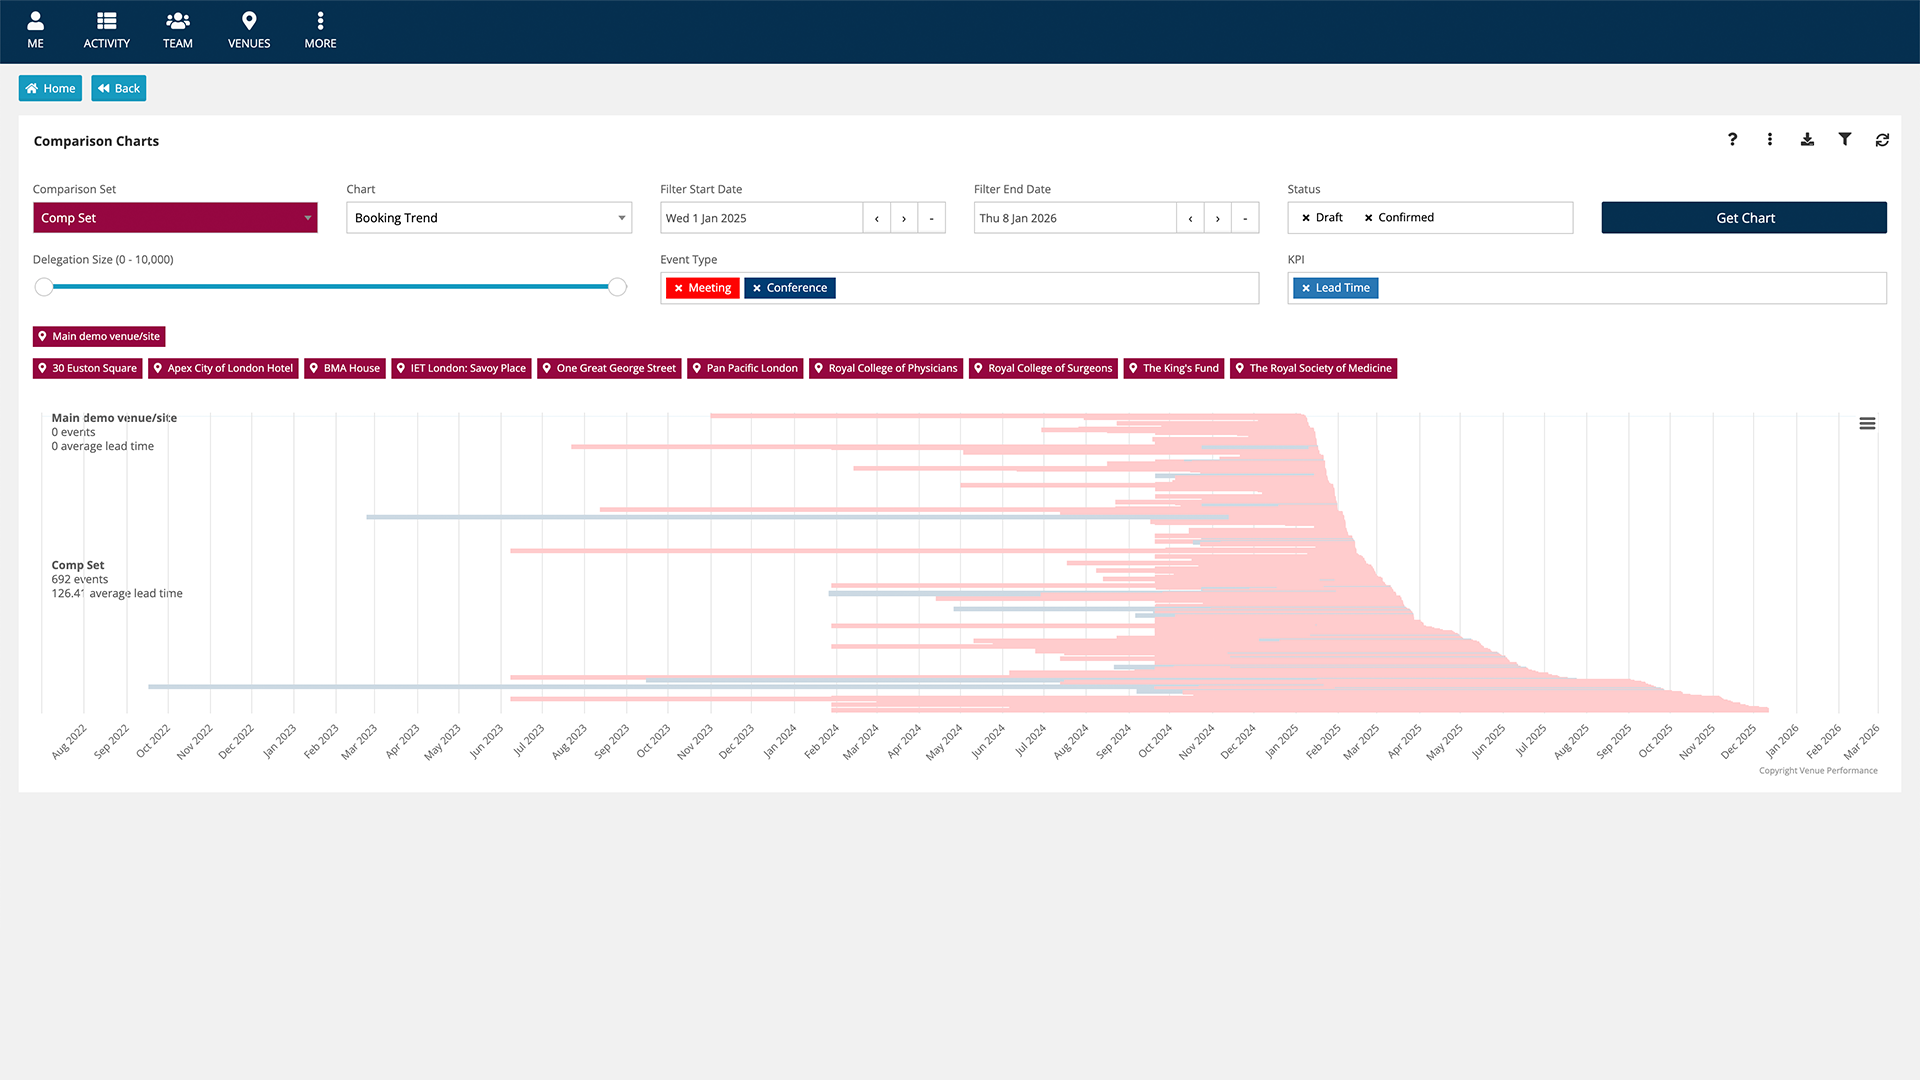
Booking trends
This is the killer report that everyone wants to know! This report will tell you what type of events are being booked, when they are being booked and when they are due to run.
It will tell you where you're missing out to your comp set, before it becomes a problem...
It's your window into the future!

Side by side
A simple 'go to' illustration of your key performance indicators against those from your comparison set. This chart offers hundreds of key learnings and actionable conclusions in the clearest way possible.
This powerful tool lets you stack and compare different datasets, whether benchmarking against competitors or analysing your own venue’s historical performance. Use all KPIs and filters—including sales, attendance, and revenue per delegate—to tailor your view and gain deeper insights.

Market share
Measure your market share for both the wider market trends as well as your comp sets.
These market reports will enable you to see how much of the market you want, have targeted, or have been successful in acquiring.

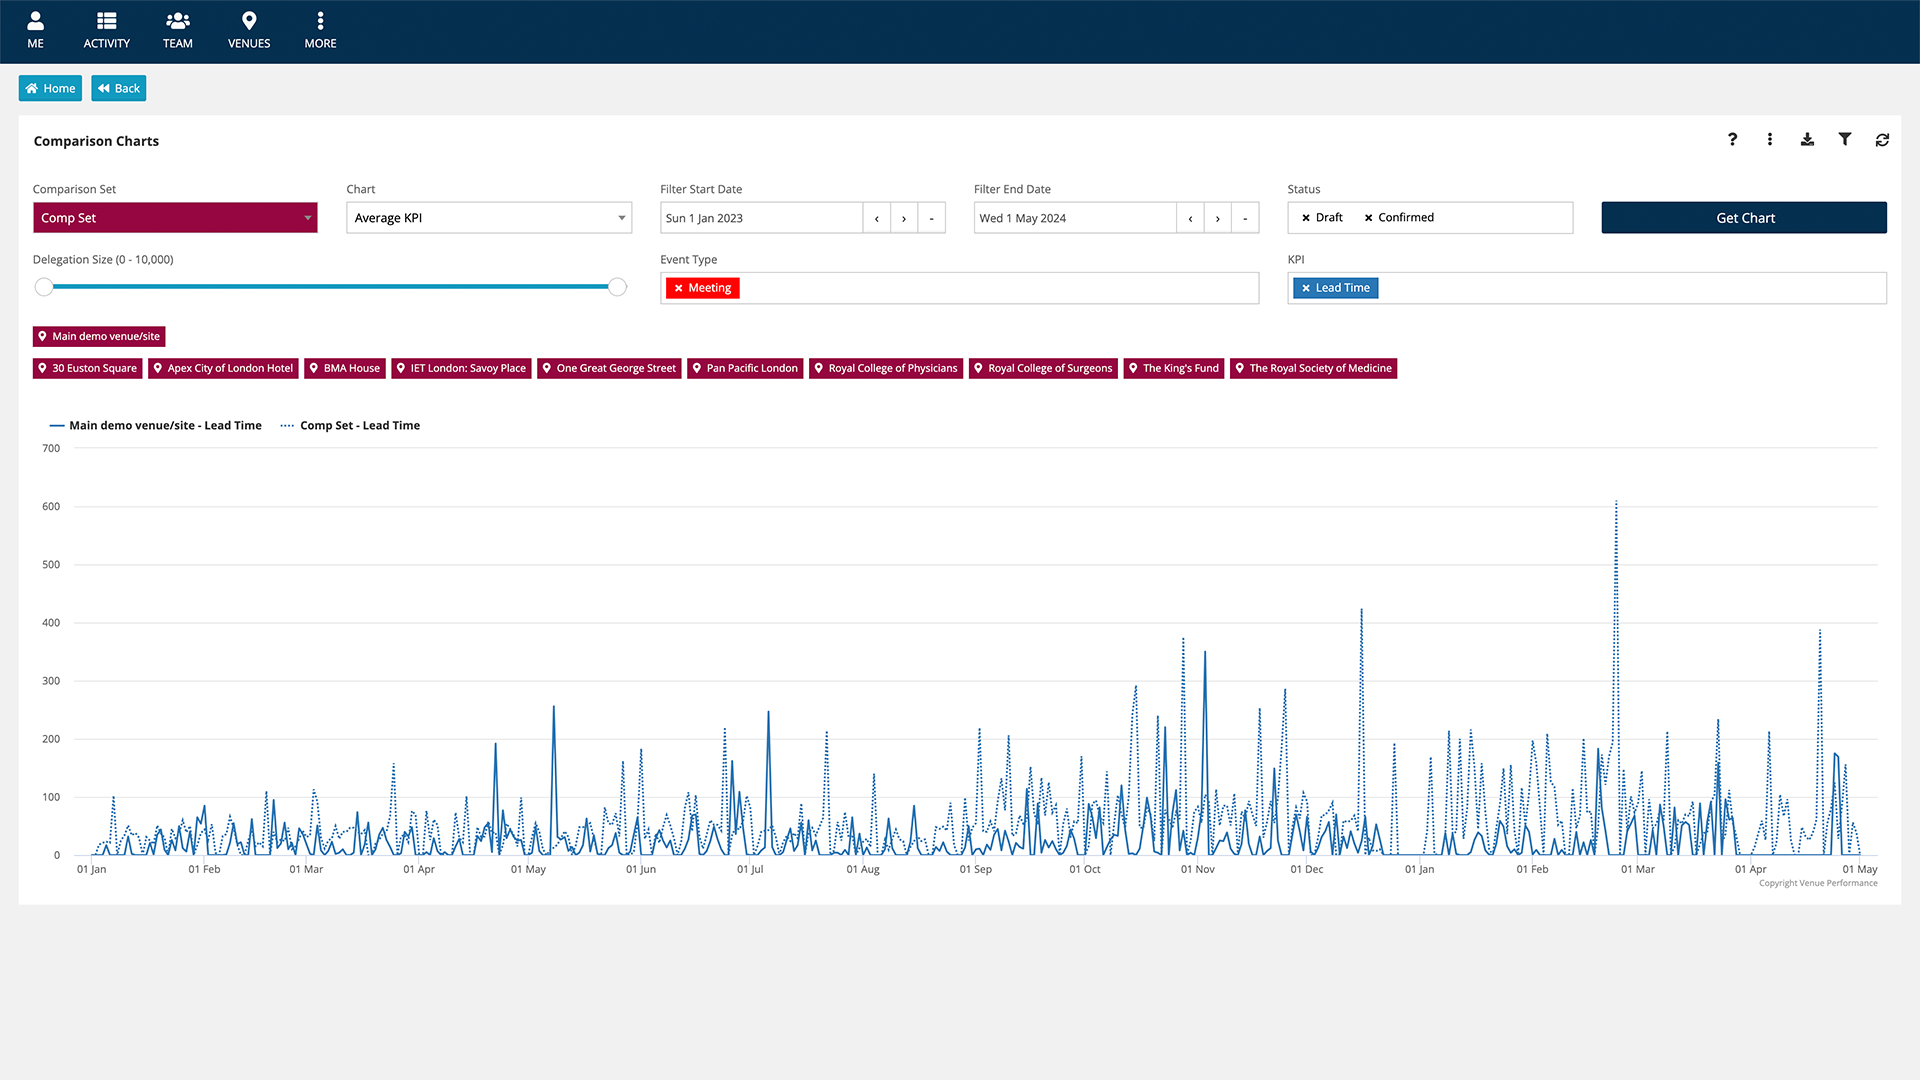
Average KPI
This chart plots KPIs on a calendar-based timeline, allowing you to quickly see which days, weeks, or months are busier.
By comparing your venue’s solid-line KPIs against the dotted-line competitors’ averages, you can pinpoint where you excel or where adjustments are needed.
Use this insight to optimise yield management, adjust pricing strategies, and refine sales activity for maximum impact.

Radar KPI
This chart is a powerful gap analysis tool.
By analysing the shape and size of the radar areas, you can quickly identify event types where your venue is over- or underperforming.
A well-matched shape indicates alignment with market trends, while gaps highlight opportunities to expand or adjust your event programming.

Radar event type
This report is a great visual tool to help you take a holistic view of yours and your comparison set's performance, as well as the wider market.
It's another way of seeing if you're on track against your objectives and where your business mix is performing well or falling behind.

REVMet™
RevMet™ (Revenue per Square Meter) is a critical performance metric that measures how much revenue you are generating from your meeting and event spaces relative to your size. It provides revenue and commercial managers with a clear view of how efficiently your space is being monetised, and how well assets are being sweated, supporting smarter decisions around pricing, layout, and sales strategies.
By benchmarking RevMet™ against competitors and similar venue types, you gain valuable context to understand your market position, identify performance gaps, and uncover opportunities for growth.

Watch quick start demo of how to navigate the platform